Navigating health ecosystems: A payer perspective
How a team of DIA Design apprentices helped to untangle a web of healthcare data and analytics, medical coding, and health risk adjustment systems


Situation: What was the situation we faced?
Health risk adjustment platforms, including the one created by our client, can be difficult to use and not designed with an overarching strategy in mind.
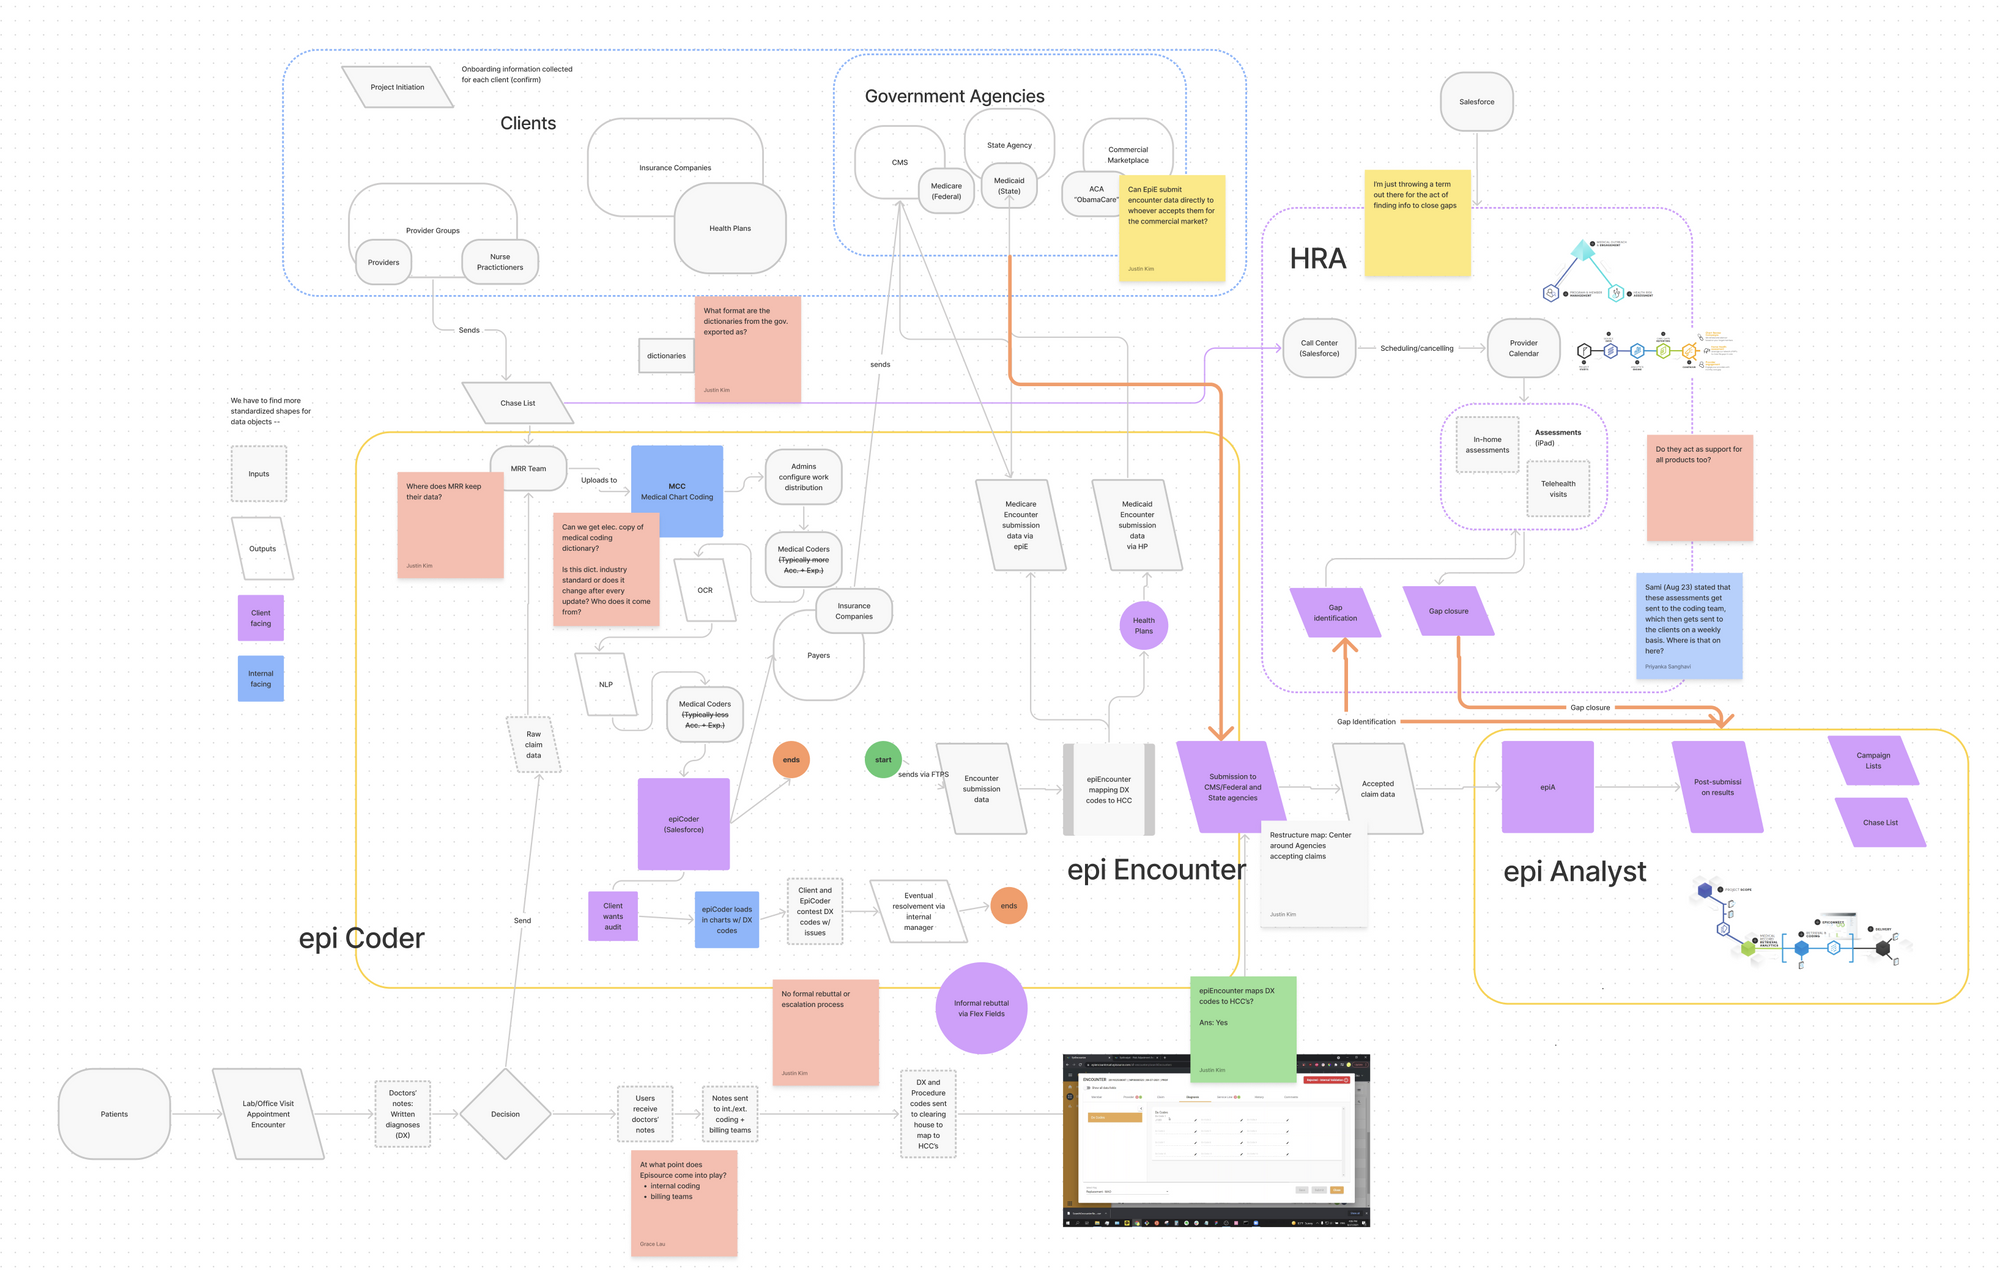
Over a 6-week assessment project, DIA Design worked with Episource to develop a current state journey map of Episource products.


We developed recommendations for their platform by focusing on 4 of their products and services.
Tasks: What tasks were involved in that situation?
Our main tasks were to:
- Create a journey map of their products
- Identify their users
- Define key user flows
- Discover user needs
We needed to figure out:
- Where products and services started and ended
- Who and what systems were involved in each step and phase
- How all Episource products fit together
Actions: What actions did you take?
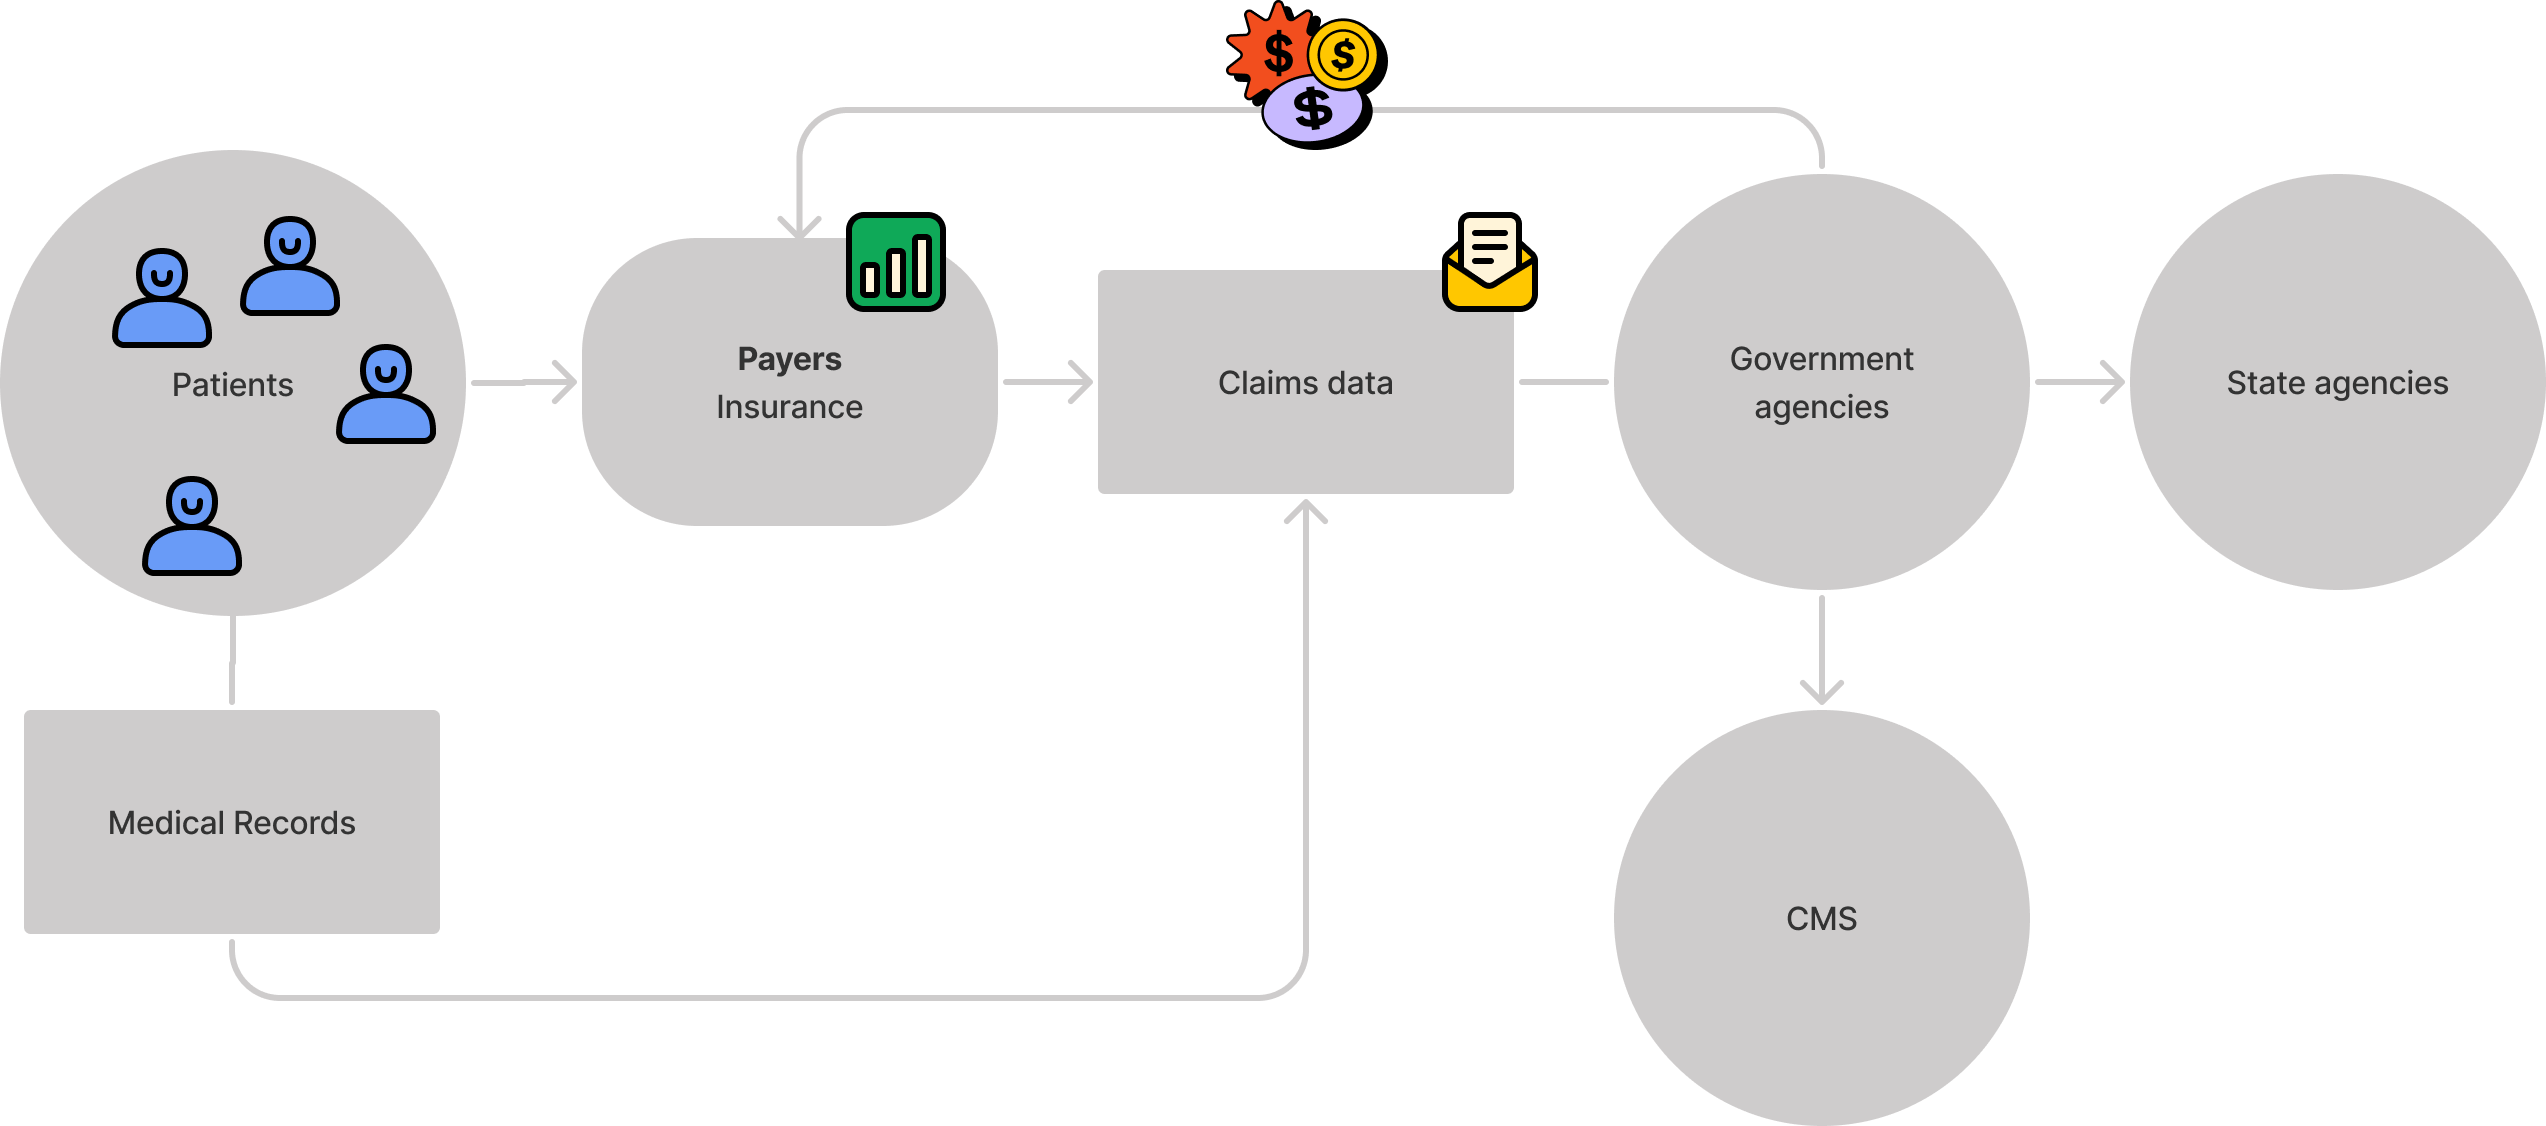
Before the project started, we researched the domain space and created an ecosystem map to understand the domain of healthcare data and analytics, Medicare reimbursement, and risk adjustment.
We brought together a team of:
- 2 designers, Jessi Shakarian and Justin Kim
- 1 researcher, Priyanka Sanghavi
- 1 data scientist, William Lage
- 1 information architect, Grace Lau
to conduct the research and discovery sessions.
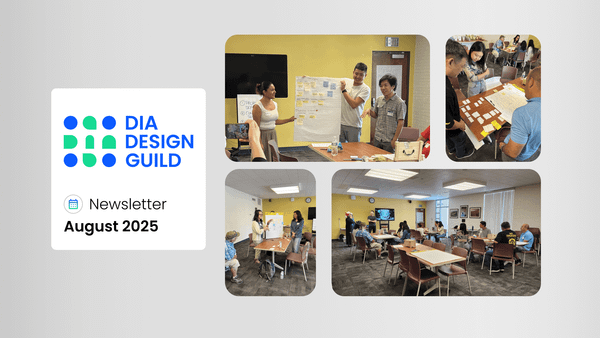
Over the course of 3 weeks, we met with product and engineering stakeholders to conduct product walkthroughs and demos.
Further activities included:
- Stakeholder interviews
- Gathered contextual information to ensure accuracy of proposed product models.
- Discovery “homework”
- Reviewed existing internal literature, diagrams, and product demos.
- Created a comprehensive visual map of existing product space.
- UX audits/Heuristic evaluation
- Identified areas for improvement by tagging product screenshots on FigJam.
- Generated findings and solutions using Nielsen Norman’s usability heuristics.
- Competitive analysis
- Compared competitors’ landing pages to the client’s products.
- Journey mapping
- Story-boarded an ideal future state for key users across each of the 4 products.
Result: What were the results of those actions?
As a team, we learned:
- a LOT about healthcare data and analytics required by the US government
- what it took to compile a thorough findings report
- how to make design recommendations for various lengths of impact
Some of our biggest learnings and takeaways as apprentices were around:
- Onboarding into an extremely complicated domain space
- Learning to set expectations for document organization
- Building confidence to ask questions
- Accepting project ambiguity and uncertainties
- Teamwork and collaboration
On the client side, Episource is bridging their product and engineering teams together to raise awareness and continue the work we started to cultivate customer-centric and research-driven culture in the organization.
Thank you and your team for the great case study work which established an important groundwork for us to start build a user focused and research driven design process in the organization!
~ Sungae Park, Head of Design, Episource LLC